Sea ice in Antarctica and the Arctic - 30-year baseline compared to recent 10-year average
- Collections
- Edition
- 1
- Published
Produced by the Mapping and Geographic Information Centre, British Antarctic Survey, 2025, version 1, https://data.bas.ac.uk/maps/1017.
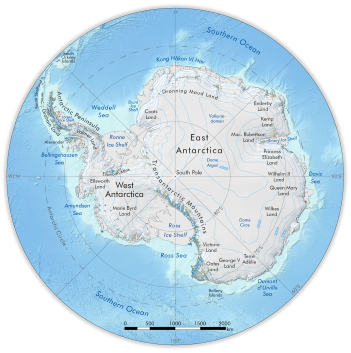
A 2 panel figure displaying sea ice extents around Antarctica and the Arctic. 30-year baseline averages (1981-2010) are shown for summer and winter, overlaid with more recent 10-year averages (2013-2022).
The Antarctic panel also displays the Polar Front, a convergence between colder and warmer waters, moving latitudinally with the season.
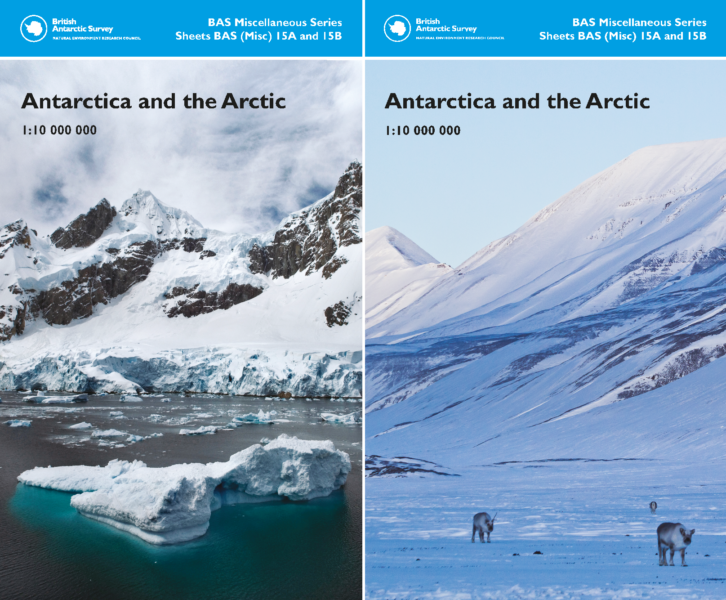
The panels are extracts from the following map:
British Antarctic Survey, 2023. Antarctica and the Arctic, 1:10 000 000 scale maps. BAS Miscellaneous Series, Sheets 15A and 15B, Edition 5. Cambridge, British Antarctic Survey.
Map projections: WGS84 Antarctic and Arctic Polar Stereographic projections.
Note
The maps are shown at different scales to suit the data and differences in regions.
Data sources and references can be found in the lineage.