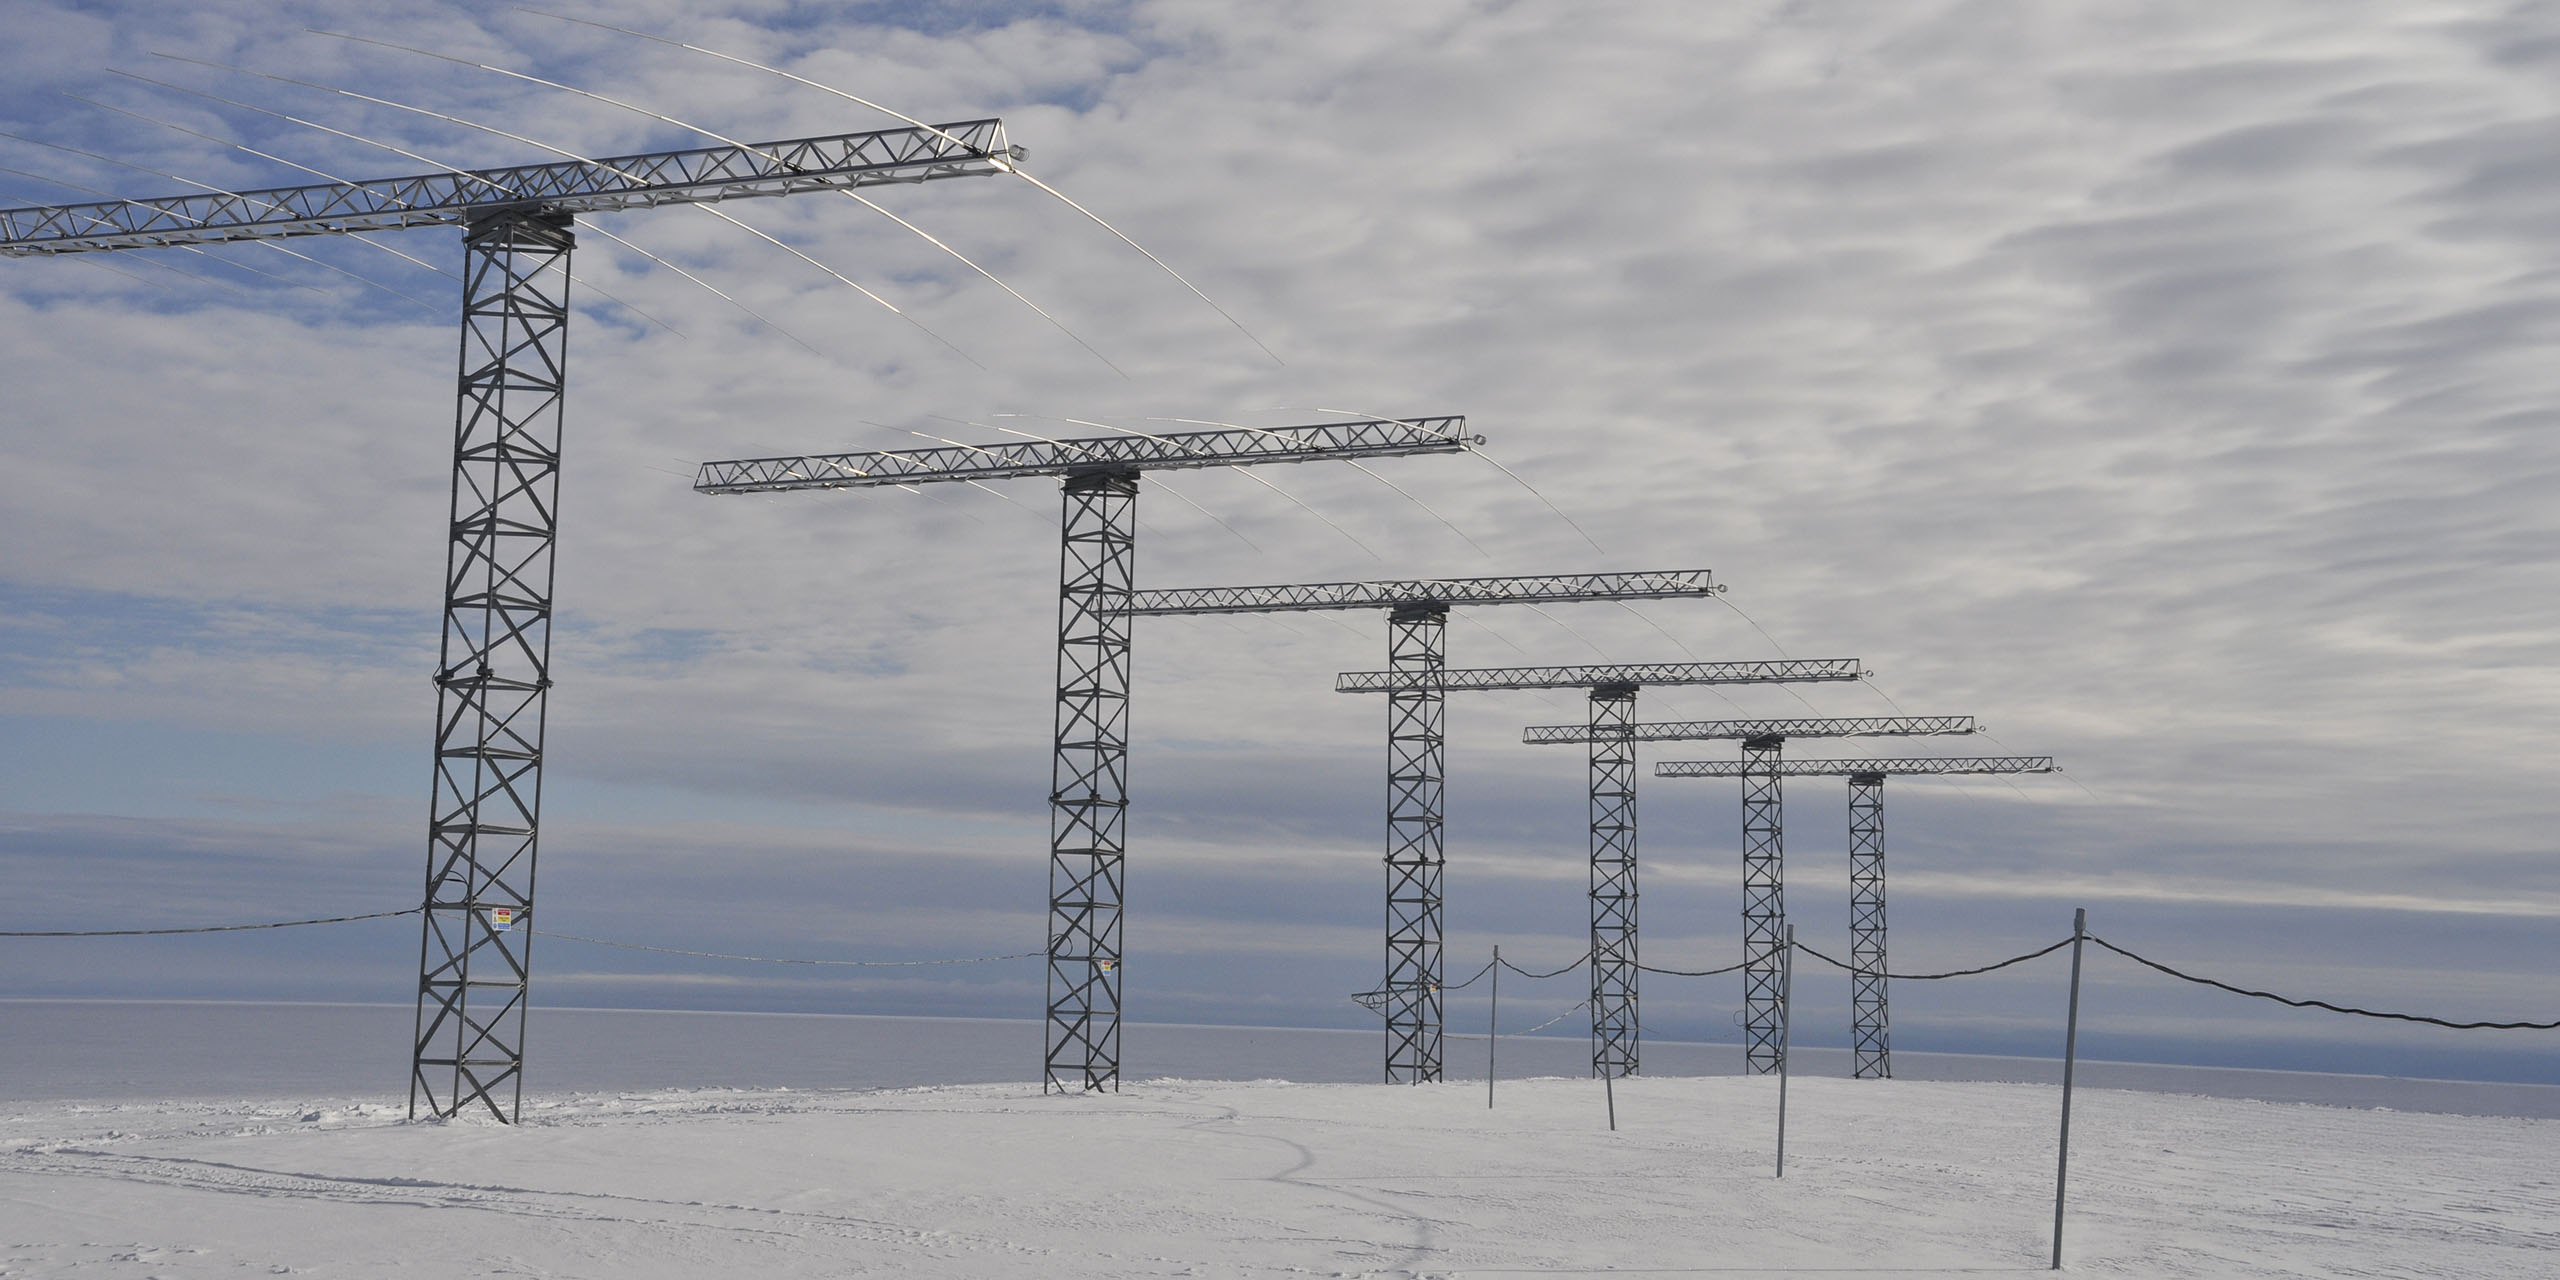
Raw and processed airborne ice-sounding synthetic aperture radar depth profiles from flights F09 and F11 segments of the FISS survey covering Recovery Ice Stream (2016-2017)
GB/NERC/BAS/PDC/02209
Page Links
Jump To:
- Citation
- Access Data
- Constraints
- Basic Information
- Additional Information
- Locality
- Instrumentation
- Storage
Related Links
Summary
Abstract:
This dataset corresponds to the raw and processed data acquired by the British Antarctic Survey (BAS) airborne Synthetic Aperture Radar (SAR) PASIN2 (Polarimetric Airborne Scientific INstrument, mark 2), designed for deep ice sounding and basal 3d-mapping. The instrument consists of an array of antennas for transmission and reception at 150 MHz central frequency, and 13 MHz bandwidth. The dataset contains unprocessed and processed SAR images as depth profiles above the Recovery Ice Stream near the grounding zone for the 2016-2017 FISS (Filchner Ice Shelf System) project flights F09 and F11, during the Antarctic Summer and their associated ancillary data. The SAR images are presented in two dimensions: 1) range (vertical); and 2) along-track (horizontal). To focus the image, first the range-processing is performed, and second the along-track focussing with the SAR processing.
The ancillary data (mainly aircraft positioning and attitude, and surface elevation) are merged into the raw data files and allow to process the SAR images. There are 84 raw data files: 52 raw data files for flight F09, and 32 for F11. The data users will be able to observe the Doppler dispersion during the data collection with the RGB Doppler Decomposition method, and perform their own SAR algorithms on the raw data.
For the processed data, we propose three types of processing. While the conventional SAR processing uses a radar signal propagation modelled by refraction, in areas near the grounding zone some images are severely defocussed, even more than at the raw data level. With this dataset we show how other propagation models using diffraction at the ice surface can greatly improve the focussing. Each of the two flight segments is processed with three different strategies: 1) range-processing only, 2) range followed by along-track with refraction, and 3) range followed by along-track with diffraction at the ice surface. The processed data thus consists of 6 processed images. SAR-processing developers or image interpreters will be able to assess the focussing quality comparing different regions of the SAR images, and apply our diffraction model to other datasets. The users can interpret the focussing quality with the intensity of each SAR image, or after the RGB Doppler Decomposition method to observe the Doppler dispersion responsible of the defocussing.
This work has received funding from the NERC grant NE/L013444/1, project: Ice shelves in a warming world: Filchner Ice Shelf System (FISS), Antarctica.
The 2016/17 data were collected as part of the NERC grant NE/L013770/1, project: Ice shelves in a warming world: Filchner Ice Shelf System (FISS), Antarctica.
Keywords:
Antarctic, PASIN2, Recovery Ice Stream, Synthetic Aperture Radar, ice thickness
Citation
Arenas-Pingarron, A., Brisbourne, A., Corr, H., Robinson, C., Jordan, T., & Nicholls, K. (2026). Raw and processed airborne ice-sounding synthetic aperture radar depth profiles from flights F09 and F11 segments of the FISS survey covering Recovery Ice Stream (2016-2017) (Version 1.0) [Data set]. NERC EDS UK Polar Data Centre. https://doi.org/10.5285/25832456-8394-415b-a090-b9f7338c08ce
Access Data
GET DATA
PROJECT HOME PAGE
REFERENCE MATERIALS
RELATED DATA SET METADATA
- https://doi.org/10.5285/0CB61583-3985-4875-B141-5743E68ABE35
- https://doi.org/10.5285/40c2f86b-1a02-4106-934a-42769682df66
- https://doi.org/10.5285/E7851BBA-21FF-4645-B557-D8EAFDF89462
- https://doi.org/10.5285/FAAC4156-047D-47BA-9E31-1A4F766BFDF8
SOFTWARE PACKAGES
- https://doi.org/10.5281/zenodo.8308421
- https://www.giss.nasa.gov/tools/panoply/
- https://www.unidata.ucar.edu/software/netcdf/
Constraints
| Access Constraints: | None |
|---|---|
| Use Constraints: | This data is covered by a UK Open Government Licence (http://www.nationalarchives.gov.uk/doc/open-government-licence/version/3/). Further by downloading this data the user acknowledges that they agree with the NERC data policy (http://www.nerc.ac.uk/research/sites/data/policy.asp), and the following conditions: 1. To cite the data in any publication. 2. The user recognizes the limitations of data. Use of the data is at the users' own risk, and there is no warranty as to the quality or accuracy of any data, or the fitness of the data for your intended use. The data are not necessarily fully quality assured and cannot be expected to be free from measurement uncertainty, systematic biases, or errors of interpretation or analysis, and may include inaccuracies in error margins quoted with the data. |
Basic Information
| Creation Date: | 2026-05-19 |
|---|---|
| Dataset Progress: | Complete |
| Dataset Language: | English |
| ISO Topic Categories: |
|
| Parameters: |
|
| Personnel: | |
| Name | UK Polar Data Centre |
| Role(s) | Metadata Author |
| Organisation | British Antarctic Survey |
| Name | Alvaro Arenas-Pingarron |
| Role(s) | Investigator |
| Organisation | British Antarctic Survey |
| Name | Dr Alex M Brisbourne |
| Role(s) | Investigator |
| Organisation | British Antarctic Survey |
| Name | Hugh F J Corr |
| Role(s) | Investigator |
| Organisation | British Antarctic Survey |
| Name | Carl Robinson |
| Role(s) | Investigator |
| Organisation | British Antarctic Survey |
| Name | Dr Tom A Jordan |
| Role(s) | Investigator |
| Organisation | British Antarctic Survey |
| Name | Dr Keith W Nicholls |
| Role(s) | Investigator |
| Organisation | British Antarctic Survey |
| Parent Dataset: | N/A |
Additional Information
| Reference: | Main reference: Alvaro Arenas-Pingarron, Alex M. Brisbourne, Tom A. Jordan, Hugh F.J. Corr, Carl Robinson, Paul V. Brennan: 'Improved focusing of Ice-Penetrating Airborne Synthetic Aperture Radar data with a diffraction-based model', Journal of Glaciology. Other references: - Fremand, A. C., Bodart, J. A., Jordan, T. A., Ferraccioli, F., Robinson, C., Corr, H. F. J., Peat, H. J., Bingham, R. G., and Vaughan, D. G.: British Antarctic Survey's aerogeophysical data: releasing 25 years of airborne gravity, magnetic, and radar datasets over Antarctica, Earth Syst. Sci. Data, 14, 3379-3410, https://doi.org/10.5194/essd-14-3379-2022, 2022. - Arenas-Pingarron, A., Corr, H., Robinson, C., Jordan, T., Brennan, P.V.: Polarimetric airborne scientific instrument, mark 2, an ice-sounding airborne synthetic aperture radar for subglacial 3D imagery. IET Radar Sonar Navig. 1-14 (2023). https://doi.org/10.1049/rsn2.124282023. - Arenas-Pingarron, A., Brisbourne, A. M., Martín, C., Corr, H. F. J., Robinson, C., Jordan, T. A., and Brennan, P. V.: An alternative representation of Synthetic Aperture Radar images as an aid to the interpretation of englacial observations, EGUsphere [preprint], https://doi.org/10.5194/egusphere-2025-1068, 2025. Related datasets: - Corr, H., Robinson, C., Jordan, T., Nicholls, K., & Brisbourne, A. (2021). Processed airborne radio-echo sounding data from the FISS 2016 surveys covering the Filchner and Halley Ice Shelves, and the English Coast (western Palmer Land), West Antarctica (2016/2017) (Version 1.0) [Data set]. NERC EDS UK Polar Data Centre. https://doi.org/10.5285/0CB61583-3985-4875-B141-5743E68ABE35 - Corr, H., Robinson, C., Jordan, T., Nicholls, K., & Brisbourne, A. (2021). Processed bed elevation picks from airborne radar depth sounding from the FISS 2016 survey covering the Filchner and Halley Ice Shelves (2016/2017) (Version 1.0) [Data set]. NERC EDS UK Polar Data Centre. https://doi.org/10.5285/E7851BBA-21FF-4645-B557-D8EAFDF89462 - Arenas Pingarron, A., Corr, H., Jordan, T., Robinson, C., Nicholls, K., & Smith, A. (2023). Airborne synthetic aperture radar ice-sounding depth profiles from Recovery Ice Stream 2016/17, and calibration data from Rothera 2016/17 and 2019/20 (Version 1.0) [Data set]. NERC EDS UK Polar Data Centre. https://doi.org/10.5285/FAAC4156-047D-47BA-9E31-1A4F766BFDF8 - Arenas Pingarron, A., Brisbourne, A., Corr, H., Jordan, T., Robinson, C., Martin, C., Nicholls, K., & Smith, A. (2023). Ice-sounding airborne synthetic aperture radar depth profiles from Recovery Ice Stream 2016/17 and Rutford Ice Stream 2019/20 to test the RGB-Doppler-Decomposition method. (Version 1.0) [Data set]. NERC EDS UK Polar Data Centre. https://doi.org/10.5285/40c2f86b-1a02-4106-934a-42769682df66 |
|
|---|---|---|
| Quality: | ** raw data ** - sampling grid: o in range: sampling at 120 MHz, interval 8.3333 nanoseconds. depth sampling in ice (lightspeed in ice of 168.3751 meter/microsecond): 0.7 meter o in along-track: sampling at 125 Hz, interval 8 milliseconds. - along-track timing: The UTC time from GPS/IMU was delayed by approximately 1 second relative to the UTC of radar raw data (only adapted to FAIR principles), so both timings were not synchronised. This is solved in the netCDF files, with the radar raw data and the positioning data are synchronised to the best of our knowledge. However, the data user can check and correct the timings, because in the dataset the original files with the processed positioning data are included. ** processed data ** The SAR images in Flight F09: - processing level: 1) only to range-processing, without SAR (along-track) focussing of any kind. 2) range-processing followed by SAR focussing with back-projection by refraction. 3) range-processing followed by SAR focussing with back-projection by diffraction. - sampling of the output (back-projection) grid: o in range: 6.48 meters/pixel, o in along-track: 8 milliseconds/pixel (125 Hz) for the image with range-processing; and 16 milliseconds/pixel (62.5 Hz) for the SAR-processed images. - lightspeed in ice: Ci = 168.3751 meters/microsecond. - spectral bandwidth: o Bw = 13 MHz in pulse (range), o Dw = 30 Hz in Doppler (along-track, with SAR processing). - average aircraft speed: V = 55.5 m/s. - processed along-track beamwidth (antenna aperture): o in air: 2 x arcsin(wavelength x (Dw/2) / (2 x V)) = 31.36°, o in ice: 17.47° in ice after refraction with refractive index 1.78. - resolution (without spectrum windowing) in ice: o in range: Ci/(2 x Bw) = 6.5 meters; o in along-track: incremented with depth according to beamwidth when only range-processing; and aimed at 1.9 meter with SAR focussing, depending on the model by refraction or by diffraction. The SAR images in Flight F11: - processing level: 1) only to range-processing, without SAR (along-track) focussing of any kind. 2) range-processing followed by SAR processing by refraction. 3) range-processing followed by SAR processing by diffraction. - sampling of the output (back-projection) grid: o in range: 6.48 meters/pixel; o in along-track: 8 milliseconds/pixel (125 Hz) for all the images. - lightspeed in ice: Ci = 168.3751 meters/microsecond. - spectral bandwidth: o Bw = 13 MHz in pulse (range), o Dw = 50 Hz in Doppler (along-track, with SAR processing). - average aircraft speed: V = 58 m/s. - processed along-track beamwidth (antenna aperture): o in air: 2 x arcsin(wavelength x (Dw/2) / (2 x V)) = 51.06°, o in ice: 28.03° after refraction with refractive index 1.78. - resolution (without spectrum windowing): o in range: Ci/(2 x Bw) = 6.5 meters; o in along-track: incremented with depth according to beamwidth when only range-processing; and aimed at 1.2 meter with SAR focussing, depending on the model by refraction or by diffraction. ** For both raw and processed data ** The amplitude and relative phase of the antenna patterns in transmission (as an array of 4 antennas) and reception (as 12 single and independent antennas), were assessed with calibration flights above the sea surface. The patterns are assumed as invariant along each session, if the antenna configuration remains. The transmitted radar pulses are not calibrated, as parameter drifts are not expected to affect the quality. |
|
| Lineage/Methodology: | ** raw data ** The raw data was collected using an airborne Synthetic Aperture Radar (SAR) PASIN2. PASIN2 is an active radar which, along the trajectory of the carrier aircraft, transmits chirped pulses and receives the pulse echoes with several antenna element or arrays. It is a 150-MHz coherent pulsed radar, transmitting chirped pulses with a linearly increasing frequency sweep, with 13 MHz bandwidth and effective pulse repetition frequency 125 Hz for each of the interleaved transmitted waveforms. On board of a De Havilland DHC-6 Twin Otter aircraft ("VP-FBL"), in ice-sounding flights the nominal speed is 60 m/s, and the terrain clearance (height above closest surface) is 300 m. PASIN2 has 12 antenna elements: 4 under the port wing to transmit and receive (switching between transmit and receive modes), 4 receive-only under the fuselage (belly), and 4 under the starboard wing to transmit and receive. In this dataset, all data collected by the radar along the flight segments: three waveforms transmitted from the port array (4 antennas, with along-wing H polarisation), two waveforms transmitted from the starboard array (4 antennas, with along-wing H polarisation), and all waveforms received from the twelve single antennas (along-wing H polarisation). The radar raw data of the two flight (F09 and F11) segments in the dataset are formatted as NetCDF (Network Common Data Format) files (.nc) for data sharing. For processing the data, the radar raw files contain the necessary ancillary data (aircraft positioning and attitude, surface elevation, etc) and metadata, including units, conventions, intervals and human-readable descriptions, among others. NetCDF file content can be explored and plotted with software such as the free stand-alone Panoply or Python. There are 84 raw data files: 52 for flight F09, and 32 for F11. Each file corresponds to 20 seconds of flight, transmitting three waveforms from port array, 2 waveforms from starboard array, and receiving from the twelve single and independent antenna elements. Two waveforms from each of the two transmitting arrays follow the 0-pi modulation, only varying in phase. The interleaved transmitted waveforms and receivers are (not sequentially listed): - 3 transmitted waveforms from port array with 4 antennas, labelled as P or 'Port', with along-wing H polarisation: o linearly increasing frequency chirp of 4 us duration and 13 MHz bandwidth, with 0°. o linearly increasing frequency chirp of 4 us duration and 13 MHz bandwidth, with 180°. o linearly increasing frequency chirp of 1 us duration and 13 MHz bandwidth, with 0°. 3 transmitted waveforms from starboard array with 4 antennas, labelled as S or 'Star', with along-wing H polarisation: o linearly increasing frequency chirp of 4 us duration and 13 MHz bandwidth, with 0°. o linearly increasing frequency chirp of 4 us duration and 13 MHz bandwidth, with 180 - 12 receivers: o the 4 from port, the 4 from belly, and the 4 from starboard The main content of the netCDF files with the raw data is SAR raw data main dimensions and variables: - 'SAR_raw_data_real': variable with the SAR raw data for transmitters and receivers with the same antennas, units 'volt'. It has four dimensions: 'profile', 'tx_waveform_grid', 'echo_delay_grid', and 'rx_adc_grid'. The variable name includes the suffix 'real', as other raw data can be in complex domain with real and imagery components, or in in-phase (I) and quadrature (Q) domain. SAR Raw data coordinates: - 'profile': dimension variable 'profile_id', with the index of the along-track profile within the raw data of each file, as an integer starting at 0 for each file. - 'echo_delay_grid': dimension variable, with the delay time of the radar echoes as sampled during the receiving window, units 'second'. - 'tx_waveform_grid': dimension variable, with the index of waveform (transmitter antenna array and pulse) during the instrument operation. - 'rx_adc_grid': dimension, with the index of the receiver (antenna element). Aircraft timing and positioning: - 'pulse_time': time at the transmitted pulse within the effective PRF of each waveform (after pulse stacking) of the whole data take (not of the SAR image), with its increment (in seconds) as the inverse of the PRF; units 'seconds since 2000-01-01'; dimension 'profile'. To obtain the waveform PRF: Recorded waveform PRF [Hz] = 1/(diff('pulse_time')) [Hz] - 'latitude_aircraft': Latitude of the aircraft, standard name 'Latitude', units 'degree_north', dimension 'profile'. - 'longitude_aircraft': Longitude of the aircraft, standard name 'Longitude', units 'degree_east', dimension 'profile'. - 'height_aircraft': Height of aircraft above WGS84 ellipsoid, standard name 'height_above_reference_ellipsoid', units 'meter', positive 'up', dimension 'profile'. - 'terrain_clearance_aircraft': terrain clearance, distance from the platform to air interface with ice, sea or ground; units 'meter'; dimension 'profile'. - 'speed_aircraft': aircraft speed, standard name 'platform_speed_wrt_air', units 'meter/second', dimension 'profile'. Aircraft attitude (rotation): - 'roll_aircraft': Aircraft roll, positive according to right-hand rule pointing towards aircraft direction (along-track), standard name 'platform_roll_starboard_down', units 'arc_degree'''', dimension 'profile'. - 'pitch_aircraft': Aircraft pitch, positive according to left-hand rule pointing towards port direction, standard name 'platform_pitch_fore_up', units 'arc_degree', dimension 'profile'. - 'yaw_aircraft'': Aircraft yaw, positive according to left-hand rule pointing upwards, perpendicular to flat sea level, standard name 'platform_yaw_fore_starboard', units 'arc_degree', dimension 'profile'. PASIN2 antennas: - 'antenna_name': variable with the string labelling each of the PASIN2 single antennas used for either transmission or reception. - 'antenna_locations_in_aircraft_body_frame': variable with the position of each antenna in the aircraft body frame, units ''meter'. The positions are in cartesian axes (X, Y, and Z): X, along-track, positive forwards; Y, along-wing, positive towards port, i.e., left side; and Z, vertical, positive upwards. The cartesian axes are centred at the crossing between wings and hull, and height above lowest point of the tyres, as if aircraft on ground (z=0). - 'antenna_locations_in_gps_body_frame': variable with the position of each antenna in the gps body frame, after subtracting the lever-arm from aircraft body frame, units 'meter'. The positions are in cartesian axes (X, Y, and Z) as for 'antenna_locations_in_aircraft_body_frame'. - 'receiver_antenna_index': variable with the index (starting by 1) of each individual antenna for each analogue-to-digital converter receiver. The indexes, from 1 to 12, are labelled from port side (P1, P2, P3, and P4, starting from the element closest to the wing tip) to belly (B5, B6, B7, and B8, starting from the element closest to port side) to starboard (S9, SA, SB, and SC, starting from the element closes to belly). - 'transmitter_antenna_index': variable with the index (starting by 1) of the individual antennas for each transmitted waveform. The indexes, from 1 to 12, are labelled from port side (P1, P2, P3, and P4, starting from the element closest to the wing tip) to belly (B5, B6, B7, and B8, starting from the element closest to port side) to starboard (S9, SA, SB, and SC, starting from the element closes to belly). PASIN2 pulses: - 'pulse_duration': two dimensional variable with the time duration of the pulse of each transmitter element (4 elements per array) in each waveform ('tx_waveform_grid' dimension), units 'seconds''. - 'pulse_bandwidth': two dimensional variable with the frequency bandwidth of the pulse of each transmitter element (4 elements per array) in each waveform ('tx_waveform_grid' dimension), units 'hertz'. - 'pulse_amplitude'': two dimensional variable with the absolute value of the amplitude of the pulse of each transmitter element (4 elements per array) in each waveform ('tx_waveform_grid' dimension), units 'volt'. - 'pulse_phase': two dimensional variable with the phase of the pulse of each transmitter element (4 elements per array) in each waveform ('tx_waveform_grid' dimension), units 'arc_degree''. - 'pulse_chirp_slope': two dimensional variable with the sign of the slope of the frequency sweep in time domain, of the pulse of each transmitter element (4 elements per array) in each waveform ('tx_waveform_grid' dimension). It is +1 (highest frequency is more delayed than the lowest) or -1 (lowest frequency is more delayed than the highest). - 'pulse_type': two dimensional variable with the maximum degree of the time-domain polynomial phase defining the frequency sweep, of the pulse of each transmitter element (4 elements per array) in each waveform ('tx_waveform_grid' dimension). It is a non-negative integer: 0 = noise pulse; 1 = unchirped (linear time-domain phase); 2 = linear frequency chirp (quadratic phase); 3 = quadratic frequency chirp (cubic phase); etc. ** processed data ** The 6 SAR product outputs (2 flight segments, each with 3 processing types) are also formatted as NetCDF. The processed images correspond to the combination of two raw data channels: transmitting an interleaved sequence of two waveforms from port array, and receiving only from the tip antenna at starboard side. The two waveforms follow the 0-pi modulation, only varying in phase. The transmitted waveforms and receivers are - 2 x transmitted waveforms (interleaved, each with 125 Hz pulse repetition frequency), from the port array with 4 antennas, labelled as 'P' or 'Port', with along-wing H polarisation: * linearly increasing frequency chirp of 4 us duration and 13 MHz bandwidth, with 0degrees. * linearly increasing frequency chirp of 4 us duration and 13 MHz bandwidth, with 180degrees. - 1 x receiver: * starboard tip antenna (labelled as 'SC'), with along-wing H polarisation. The aim of the 0-pi modulation is to cancel common sources of interference or noise. Given two ideally transmitted waveforms, 'w1' and 'w2', common interference 'n' might be present during the transmission and reception, and in the off-line processing the received signals 's1' and 's2' will be subtracted to compensate the 180° phase offset: s1 = w1 + n s2 = w2 + n = - w1 + n s = s1 - s2 = 2w1 The data processing is performed off-line, with a full workflow consisting of 1) channel calibration, and 2) 2D SAR imaging, based on pulse-compression for range dimension, and back-projection for along-track dimension. In this dataset, for each of the two flight (F09 and F11) segments, three SAR images are included, one for each processing type: - Range-compression: an only range-focussed image (without along-track focussing). This component of the data set was included to show the natural defocussing of the SAR data take, and the need for a SAR processing. - Back-projection by a refraction model of the signal propagation: SAR processing with the typical model of refracted waves at the ice surface and englacial layers. This component of the data set was included to show the defocussing when the conventional but wrong propagation model was used in fast-flowing ice. In the images included, the refraction model is accurate only above regions with stagnant or slow-flowing ice. Depending on the depth, the defocussing is even greater than in the range-compression image, which might seem counterintuitive. The immediate consequence is the need of re-processing with more accurate propagation models. - Backprojection by a diffraction model of the signal propagation: SAR processing with the new model of diffracted waves at the ice surface and englacial layers. This image shows the focussing in fast-flowing ice, grounded or afloat, along- or across-flow. However, it offers very poor results in stagnant or slow-flowing ice. The most import global variables in the netCDF files are SAR image samples, complex numbers with real and imaginary components: - 'SAR_image_real': Real part of complex processed SAR image, units 'volt', dimensions 'profile' and 'radial_depth_grid'. - 'SAR_image_imag': Imaginary part of complex processed SAR image, units 'volt', dimensions 'profile' and 'radial_depth_grid'. SAR image coordinates: - 'profile': dimension variable 'profile_id', with the index of the profile within the SAR image, as an integer starting at 0. It is the main dimension ('unlimited' according to netCDF terminology) of the file, included in most of the netCDF variables. It is filled with blocks or chunks of 512 samples, so variables with this dimension could have the last samples of the last block filled with 'fill' values until completing the block. - 'radial_depth_grid': dimension variable, with the depth grid in the SAR image as the vertical location below (positive) and above (negative) surface, units 'meter', positive ''down', axis 'z'. - 'pulse': Index of the transmitted pulse within the effective PRF of each waveform (after pulse stacking) of the whole data take (not of the SAR image), and its increment is the subsampling factor to get the SAR-image PRF from the effective PRF of each waveform, or vice versa; dimension 'profile'. To obtain the PRF of each waveform during the data take from the SAR-image PRF: waveform PRF [Hz] = diff('pulse') x SAR-image PRF [Hz] - 'pulse_time': time at the transmitted pulse within the effective PRF of each waveform (after pulse stacking) of the whole data take (not of the SAR image), with its increment (in seconds) as the inverse of the SAR-image PRF; units seconds since 2000-01-01; dimension 'profile'. To obtain the SAR-image PRF: SAR-image PRF [Hz] = 1/(diff('pulse_time') [Hz] SAR image processing: - 'along_track_aperture_angle': Beamwidth of the full aperture for the SAR processing, units ''arc_degree'. If it is zero, the processing is only range-processing (without SAR, along-track focussing). If it is nonzero (only positive), there is SAR processing. - 'em_propagation_model': unsigned integer with the type of electromagnetic propagation model, dimensionless unit, dimension 'profile'. It is 0 for pure refraction at the ice surface; and 1 for diffraction at the ice surface. PASIN2 antennas: - 'antenna_name': variable with the string labelling each of the PASIN2 single antennas used for either transmission or reception. - 'antenna_locations_in_aircraft_body_frame': variable with the position of each antenna in the aircraft body frame, units 'meter'. The positions are in cartesian axes (X, Y, and Z): X, along-track, positive forwards; Y, along-wing, positive towards port, i.e., left side; and Z, vertical, positive upwards. The cartesian axes are centred at the crossing between wings and hull, and height above lowest point of the tyres, as if aircraft on ground (z=0). - 'antenna_locations_in_gps_body_frame': variable with the position of each antenna in the gps body frame, after subtracting the lever-arm from aircraft body frame, units 'meter''. The positions are in cartesian axes (X, Y, and Z) as for 'antenna_locations_in_aircraft_body_frame'. - 'receiver_antenna_index': variable with the index (starting by 1) of each individual antenna for each analogue-to-digital converter receiver. The indexes, from 1 to 12, are labelled from port side (P1, P2, P3, and P4, starting from the element closest to the wing tip) to belly (B5, B6, B7, and B8, starting from the element closest to port side) to starboard (S9, SA, SB, and SC, starting from the element closes to belly). - 'transmitter_antenna_index'': variable with the index (starting by 1) of the individual antennas for each transmitted waveform. The indexes, from 1 to 12, are labelled from port side (P1, P2, P3, and P4, starting from the element closest to the wing tip) to belly (B5, B6, B7, and B8, starting from the element closest to port side) to starboard (S9, SA, SB, and SC, starting from the element closes to belly). PASIN2 pulses: - 'pulse_duration': two dimensional variable with the time duration of the pulse of each transmitter element (4 elements per array) in each waveform ('transmitters_waveforms_receivers' dimension), units 'seconds'. - 'pulse_bandwidth': two dimensional variable with the frequency bandwidth of the pulse of each transmitter element (4 elements per array) in each waveform ('transmitters_waveforms_receivers' dimension), units 'hertz'. - 'pulse_amplitude': two dimensional variable with the absolute value of the amplitude of the pulse of each transmitter element (4 elements per array) in each waveform ('transmitters_waveforms_receivers' dimension), units 'volt'. - 'pulse_phase': two dimensional variable with the phase of the pulse of each transmitter element (4 elements per array) in each waveform ('transmitters_waveforms_receivers' dimension), units 'arc_degree'. - 'pulse_chirp_slope': two dimensional variable with the sign of the slope of the frequency sweep in time domain, of the pulse of each transmitter element (4 elements per array) in each waveform ('transmitters_waveforms_receivers' dimension). It is +1 (highest frequency is more delayed than the lowest) or -1 (lowest frequency is more delayed than the highest). - ''pulse_type': two dimensional variable with the maximum degree of the time-domain polynomial phase defining the frequency sweep, of the pulse of each transmitter element (4 elements per array) in each waveform ('transmitters_waveforms_receivers' dimension). It is a non-negative integer: 0 = noise pulse; 1 = unchirped (linear time-domain phase); 2 = linear frequency chirp (quadratic phase); 3 = quadratic frequency chirp (cubic phase); etc. Aircraft positioning: - 'latitude_aircraft': Latitude of the aircraft, standard name 'Latitude', units 'degree_north', dimension 'profile'. - 'longitude_aircraft'': Longitude of the aircraft, standard name 'Longitude', units 'degree_east', dimension 'profile'. - 'height_aircraft': Height of aircraft above WGS84 ellipsoid, standard name 'height_above_reference_ellipsoid', units 'meter', positive 'up', dimension 'profile'. - 'terrain_clearance_aircraft': terrain clearance, distance from the platform to air interface with ice, sea or ground; units 'meter'; dimension 'profile'. - 'speed_aircraft': aircraft speed, standard name 'platform_speed_wrt_air', units 'meter/second', dimension 'profile'. Aircraft attitude (rotation): - 'roll_aircraft': Aircraft roll, positive according to right-hand rule pointing towards aircraft direction (along-track), standard name 'platform_roll_starboard_down', units 'arc_degree', dimension 'profile''. - 'pitch_aircraft': Aircraft pitch, positive according to left-hand rule pointing towards port direction, standard name 'platform_pitch_fore_up', units 'arc_degree', dimension 'profile'. - 'yaw_aircraft': Aircraft yaw, positive according to left-hand rule pointing upwards, perpendicular to flat sea level, standard name 'platform_yaw_fore_starboard', units 'arc_degree', dimension 'profile'. |
|
Locality
| Temporal Coverage: | |
|---|---|
| Start Date | 2016-12-30 |
| End Date | 2017-01-01 |
| Spatial Coverage: | |
| Latitude | |
| Southernmost | -81.0548 |
| Northernmost | -80.9056 |
| Longitude | |
| Westernmost | -38.3787 |
| Easternmost | -36.3101 |
| Altitude | |
| Min Altitude | 355m |
| Max Altitude | 634m |
| Depth | |
| Min Depth | -50m |
| Max Depth | 1998m |
| Latitude | |
| Southernmost | -81.0143 |
| Northernmost | -80.894 |
| Longitude | |
| Westernmost | -37.6727 |
| Easternmost | -36.6677 |
| Altitude | |
| Min Altitude | 358m |
| Max Altitude | 510m |
| Depth | |
| Min Depth | -180 |
| Max Depth | 2198 |
| Location: | |
| Location | Antarctica |
| Detailed Location | Filchner Ice Shelf |
| Location | Antarctica |
| Detailed Location | Recovery Glacier |
Instrumentation
| Data Collection: | The data were collected with the British Antarctic Survey (BAS) PASIN2 (Polarimetric Airborne Scientific INstrument, mark 2), an airborne Synthetic Aperture Radar (SAR) at 150 MHz (wavelength = 2 m in vacuum) and 13 MHz bandwidth, designed for deep ice sounding and basal 3d-mapping mounted on the BAS Twin Otter "VP-FBL " aircraft. It can be operated as part of a geophysical suite with additional radars, sensors for magnetic and gravity field detection, lidar and a camera. Accurate time and positional data are obtained via geodetic GPS. Antennas PASIN2 has 12 antenna elements: 8 underwing-antennas switching between transmit (TX) and receive (RX) modes, and 4 pod-antennas being RX-only. The 8 TX/RX elements are folded dipoles of length 0.39wavelength, 4 at each side (port and starboard) and separated by 0.8wavelength. The 4 RX-only are end-loaded printed dipoles within a radome attached to the fuselage, with a separation of 0.5wavelength, and are referred as belly. The 12 elements are independent receivers, whereas the 4 elements in port and starboard arrays are each an array, hence achieving 24 phase centres (2TX, 12RX), non-unique. The wings, with a slope (dihedral) of σ = 3.5 degrees, behave as plane reflectors for port and starboard elements, directing the TX pattern of each array towards different directions. The antenna orientation is always within a horizontal plane, never vertical. The convention for naming the orientations is H for along-wing, and V for along-track (if a photograph of the antennas was taking above the aircraft, in the two-dimensional photograph H would have a horizontal orientation, and V vertical). The polarization must be manually changed before taking off, in port and starboard. In this dataset, the antenna polarizations for transmission and reception were always H (along-wing). Transmitter configuration The transmission method was time-division multiplexing with a system pulse repetition frequency (SPRF) of 15.625 kHz, and a (full cycle) receiving window of 64 us (microseconds). In the data take of this dataset, the number of pre-programmed alternating transmitted waveforms was 5, including TX side and pulse type. The transmitted signals were generated with an arbitrary waveform generator (AWG), directly tuning the carrier frequency to 150 MHz. The AWG has two independent outputs, for port and starboard, and each divides into four towards separated low pass filters, high-power amplifiers and the antenna elements. In this dataset, the raw data includes all the transmitted waveforms from port and starboard arrays; and the processed images only include waveforms from port array. Waveforms In this dataset, the raw data includes the 5 waveforms during the flights; and the processed images only includes a subset of 2 transmitted waveforms. PASIN2 transmits independently from antenna arrays in port and starboard, each made of four antenna elements. The transmitted pulses were chirps with linear frequency modulation. The bandwidth is limited to 13 MHz, with duration of 1 us (microseconds) or 4 us. To filter common interference and analogue-to-digital converter (ADC) offsets, the 4us-pulses were transmitted with two different phases from each antenna array: one shifted 180degrees relative to the other (0-pi modulation). The cycle of 5 interleaved waveforms was: 1) port-4us-0degrees; 2) starborad-4us-0degrees; 3) port-4us-180degrees; 4) starboard-4us-180degrees; and 5) port-1us-0degrees. This processed images only includes the 4-us waveforms from port array. In the off-line processing, received signals from both 0degrees and 180degrees waveforms are subtracted, cancelling the common sources and increasing the SNR by 3 dB, with a coherence interval of 128 us, or 7.7 mm for an aircraft speed 60 m/s. Receiver configuration In this dataset, the raw data includes the 12 receivers available during the flights; and the processed images only includes 1 of the 12. In reception, after a low pass filter, each channel is digitised at 120 MHz rate (ADC, Pentek 71660 4-channel 16-bit digitizer on a custom FPGA), and echoes from the same waveform within 25 transmitted cycles are stacked (summed), giving an effective pulse repetition frequency (PRF) of 125 Hz as a result of dividing the system pulse repetition frequency (SPRF = 15.625 kHz) by 5 (waveforms) and by 25 (stacking). In the processed images, the reception was only from the starboard receiver SC (the closest to the starboard wing tip), an antenna nnot used for transmitting the waveforms of the processed images. However, PASIN2 includes 12 independent receivers, distributed in three separated units for port, belly and starboard sections, each with four independent analogue-to-digital converters. |
|---|
Storage
| Distribution: | |
|---|---|
| Distribution Media | Online Internet (HTTP) |
| Distribution Size | 144 GB |
| Distribution Format | netCDF |
| Fees | N/A |
| Data Storage: | This dataset contains data from: - 2016-2017 FISS campaign radio echo-sounding data from flight F09: * Raw data: 52 files ~88 GB * Processed data: 3 files ~489 MB * GPS: 3 files ~26 MB - 2016-2017 FISS campaign radio echo-sounding data from flight F11: * Raw data: 32 netCDF files ~57 GB * Processed data: 3 netCDF files: ~489 MB * GPS: 3 files ~26 MB |